The Unexpected Connections Between Weather Pattern Data and Sports Betting Odds Adjustments During Major League Seasons
Devon Butler · Sep 8, 2026

The Unexpected Connections Between Weather Pattern Data and Sports Betting Odds Adjustments During Major League Seasons
Weather pattern data has become a critical input for sportsbooks that adjust betting odds across major league seasons, and researchers track these shifts through integrated meteorological models that feed directly into algorithmic pricing systems. Major leagues including MLB and the NFL see regular modifications to lines on totals, spreads, and player props when forecasts indicate changes in wind speed, precipitation, or temperature that alter game dynamics on the field.
How Weather Influences Game Outcomes in Professional Leagues
Baseball games experience measurable effects from humidity levels and barometric pressure, which alter ball flight distances and pitcher grip consistency, while football contests show similar patterns when sustained winds exceed 15 miles per hour and reduce completion percentages for quarterbacks. Data compiled by the National Oceanic and Atmospheric Administration demonstrates that outdoor venues record higher variance in scoring during periods of rapid front movements, and betting markets respond by widening or narrowing totals lines within hours of updated forecasts.
Teams playing in domed or retractable-roof stadiums still face indirect impacts because road opponents arrive from climates that affect travel fatigue and warm-up routines, and oddsmakers incorporate these variables alongside surface conditions at open-air facilities. September 2026 schedules across both leagues coincide with peak hurricane season in the eastern United States, prompting sportsbooks to monitor tropical systems that threaten postponements and force line movements even before official weather advisories reach the public.
Data Integration Between Meteorology and Betting Markets
Sportsbooks maintain proprietary databases that merge real-time radar imagery, ensemble forecast models, and historical performance metrics by venue, and these systems trigger automatic odds recalibrations when probability thresholds for weather-related scoring changes are crossed. Analysts at research institutions have documented correlations between specific atmospheric conditions and betting market efficiency, noting that early line adjustments often occur 24 to 48 hours before game time when high-resolution models stabilize.
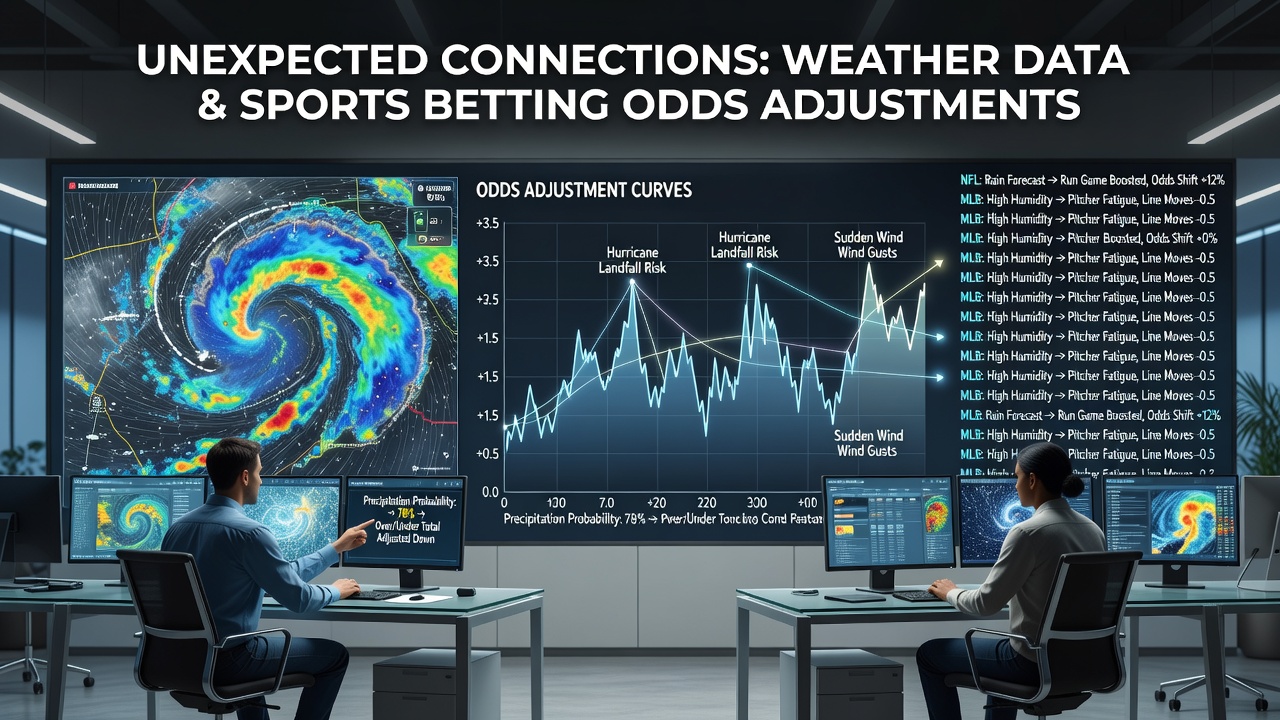
Environment and Climate Change Canada provides parallel datasets for cross-border leagues, and operators combine these sources with U.S. records to refine models for teams traveling between climates during extended road trips. One documented case involved a late-season MLB series where shifting jet stream patterns prompted multiple sportsbooks to move the over/under line downward by half a run within a single afternoon as wind direction forecasts shifted from outfield carry to infield suppression.
Technological Systems Driving Real-Time Adjustments
Algorithmic platforms now ingest satellite-derived atmospheric profiles and ground station observations at intervals as short as 15 minutes, allowing odds to reflect emerging conditions such as unexpected cold fronts that stiffen baseballs or sudden gusts that favor field goal kickers. Industry reports from gaming associations indicate that these automated feeds reduce manual intervention yet still require human oversight when forecast uncertainty remains elevated near game start times.
Player prop markets show the most granular responses because wind vectors and temperature gradients affect individual skill execution more visibly than aggregate team totals, and sharp bettors who monitor National Weather Service updates frequently place wagers before lines fully incorporate the latest model runs. Universities conducting sports analytics research have published findings that link specific dew point ranges to changes in batting average on balls in play, providing additional layers that sophisticated betting operations layer into their pricing engines.
Regional Variations and Seasonal Patterns
Stadiums located in coastal or mountainous areas exhibit stronger weather-driven line volatility than inland facilities, and operators adjust their risk management thresholds accordingly during months when jet stream positioning creates frequent temperature swings. Data from September 2026 illustrates how early autumn cold outbreaks in the Midwest prompted several sportsbooks to shade totals lower for night games while leaving day games relatively stable.
Cross-league comparisons reveal that NFL betting markets react more aggressively to precipitation forecasts than MLB markets because field conditions affect both passing and rushing efficiency simultaneously, whereas baseball responds primarily through pitching and hitting metrics. Observers note that these differences require distinct modeling approaches and that firms maintaining separate weather teams for each sport maintain competitive edges in line accuracy.
Conclusion
Weather pattern integration into sports betting odds continues to evolve as meteorological resolution improves and major league schedules expand into shoulder seasons with heightened atmospheric variability. Organizations that successfully fuse forecast accuracy with historical venue data produce more stable pricing across game totals and player props, while the underlying datasets from government agencies remain foundational to these operational frameworks.